Identification of gene defects
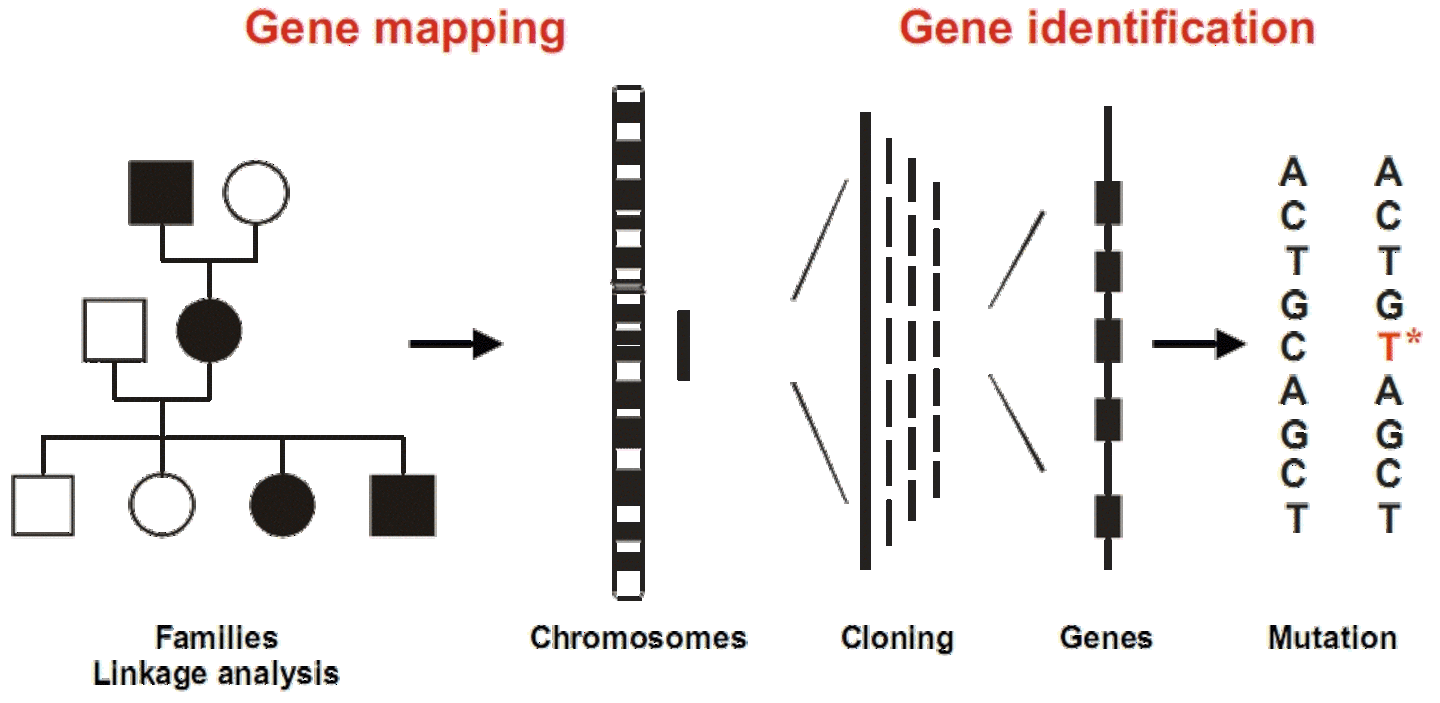
Positional cloning
Positional cloning is widely used for the identification of gene defects that underlie inherited diseases. A necessary first step for positional cloning is the mapping of the gene locus that co-segregates within families with a particular disease or trait, which allows to allocate the responsible gene to a specific chromosomal position.
Scheme of the positional cloning strategy for disease gene identification. |
High-throughput genotyping
One of the tasks of the Cologne Center for Genomics is a necessary precondition for the mapping of genes by linkage analysis, which are responsible for monogenic or complex diseases. Linkage bases on the recombination process during meiosis. Two monogenic traits (markers) are in a linkage distance if they are located on the same chromosome in a range of < 50 mega bases (dependent on the local recombination frequency). Linkage is visible through a deviation from the "normal" 50% recombination frequency. As a rule, one has to analyse 10 informative meioses (according to a LOD score of 3) to reach the accepted significance, but it also depends on the chosen parametric model, penetrance vectors or the mutation frequency in the population.
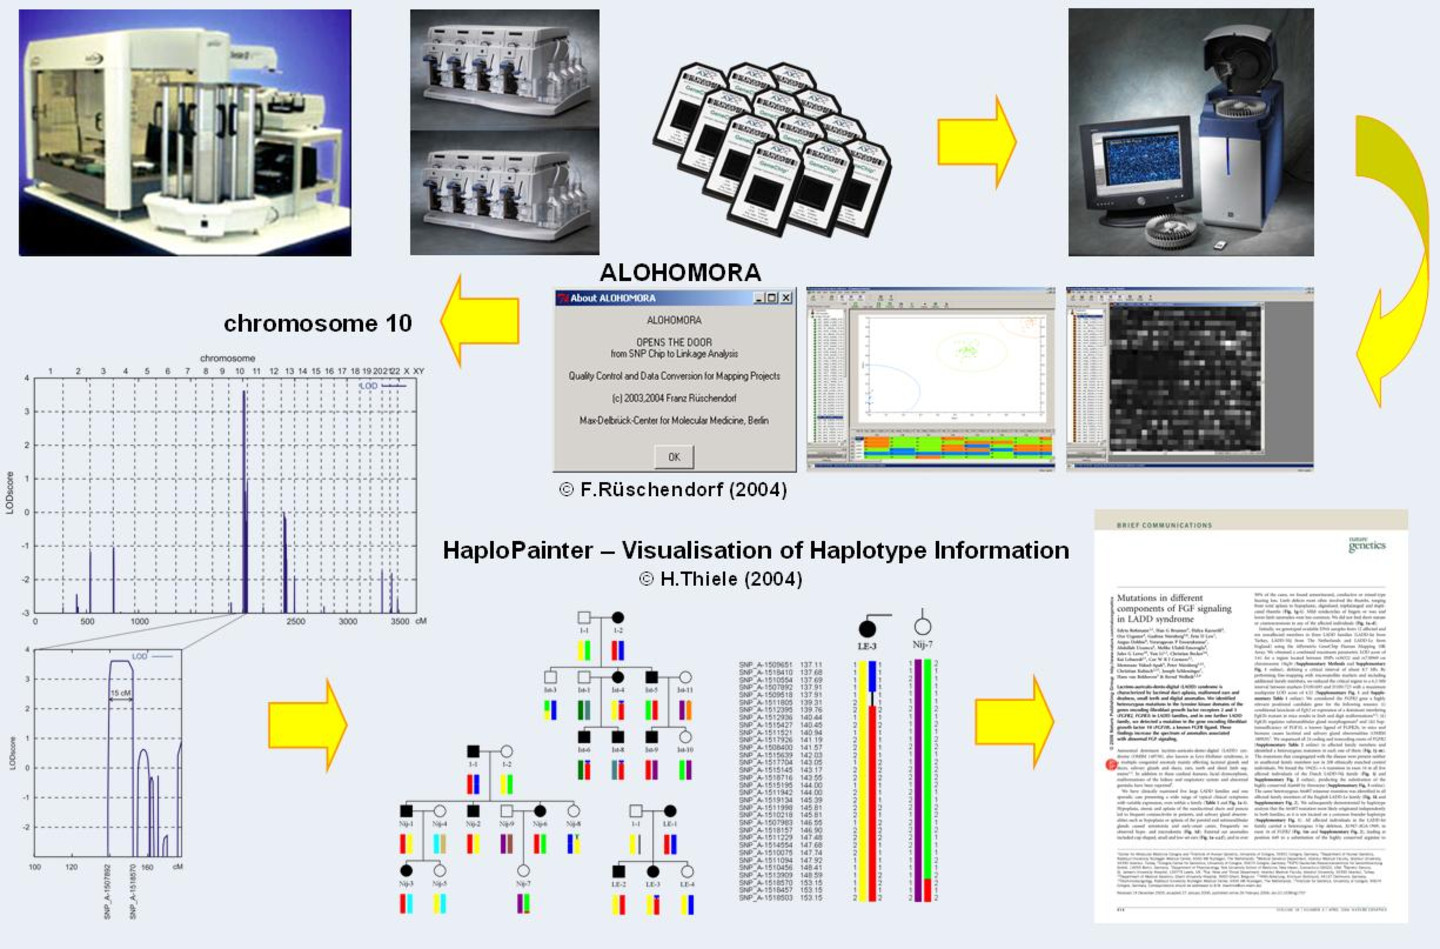
For a proper indentification of recombination events a lot of variable loci have to be analyzed. Previously, it required approximately 400 microsatellites to reach the necessary informativity level. Today, single nucleotide polymorphism = SNP arrays are preferably used. Their advantage is the much faster data generation. Unfortunately, SNPs are very uninformative, but you can make appropriate offset by an increase in the number of SNPs (>10.000). We have implemented the SNP array technology for this step and streamlined the whole process to expedite the identification of candidate genes.
The aim of subsequent data analysis is to map a disease locus for the given disease on a specific region of a chromosome as precisely as possible.
Software
- ALOHOMORA (Rüschendorf et al., 2005) is a software tool designed to facilitate genome-wide linkage studies performed with high-density single nucleotide polymorphism (SNP) marker panels such as the Affymetrix GeneChip(r) Human Mapping 10K or 500K Array. With ALOHOMORA, a comprehensive quality control of the data can be performed accessing other freely available programs. Gender of samples is checked by counting the heterozygote SNPs on the X-chromosome and comparing it to the pedigree file information.
- The correct relationships within the families is checked by the program GRR (Abecasis et al., 2001).
- PedCheck is used for detection of Mendelian errors (O'Connell and Weeks, 1998). SNPs with Mendelian errors and SNPs that are not informative for any individual of a dataset can be selectively removed from the data.
- Non-Mendelian errors can be identified by using the program MERLIN (Abecasis et al., 2002) and unlikely genotypes for related samples are deleted. "Unlikely genotypes" are equivalent to double recombinations in a short chromosomal segment. The reasons for unlikely genotypes may be genotyping errors or a wrong SNP position in the genetic map.
- Nonparametric linkage analysis using all genotypes of a chromosome simultaneously is carried out with MERLIN.
- Parametric linkage analysis is performed by a modified version of the program GENEHUNTER 2.1 (Kruglyak et al., 1996; Strauch et al., 2000) through stepwise use of a sliding window and by the program ALLEGRO (Gudbjartsson et al., 2000).
- Haplotypes are reconstructed with ALLEGRO or MERLIN and presented graphically with HaploPainter (Thiele et al., 2005).
Example 1: Swiss Family Segregating Juvenile Cataract with Microcornea and Glucosuria
We began with linkage analysis with the Affymetrix GeneChip Human Mapping 10K Array, version 2.0 (Affymetrix, Santa Clara, CA). Nonparametric linkage analysis with all genotypes of a chromosome simultaneously was carried out with MERLIN, and parametric linkage analysis was performed by the program ALLEGRO assuming a disease allele frequency of 0.0001 and autosomal dominant inheritance with full penetrance for cataract. Haplotypes were reconstructed with ALLEGRO and presented graphically with HaploPainter. Results predicted that the diseasecausing mutation for the juvenile cataract and microcornea maps to an interval on chromosome 10q23.31 (Figure 2) of 3 cM, spanning between the SNP markers rs701826 and rs2254391 (Figure 3).
About 35 genes could be identified inside the narrowed 3 cM region, according to a physical distance of 2.6 mega bases. A hypothesis-based selection process resulted in the identification of a nonsense mutation in the disease causing gene SLC16A12. We found tissue-specific variability of SLC16A12 transcript levels in control samples, with high expression in the eye and kidney, the two organs affected by this syndrome. We hypothesize that SLC16A12 is important for lens and kidney homeostasis and has significance in age-related cataract.
Reference
Kloeckener-Gruissem B, Vandekerckhove K, Nürnberg G, Neidhardt J, Zeitz C, Nürnberg P, Schipper I, Berger W.: Mutation of Solute Carrier SLC16A12 Associates with a Syndrome Combining Juvenile Cataract with Microcornea and Renal Glucosuria. Am J Hum Genet. 2008, Mar;82(3):772-9.
Example 2: cblF defect of vitamin B12 metabolism
If we have many individual samples or many families for performing homozygosity mapping then we introduced consanguineous loops into all families. For the parametric linkage analysis we used the programs ALLEGRO and a new version of MERLIN that allows for marker clustering to compensate for linkage disequilibrium (LD) between adjacent markers.
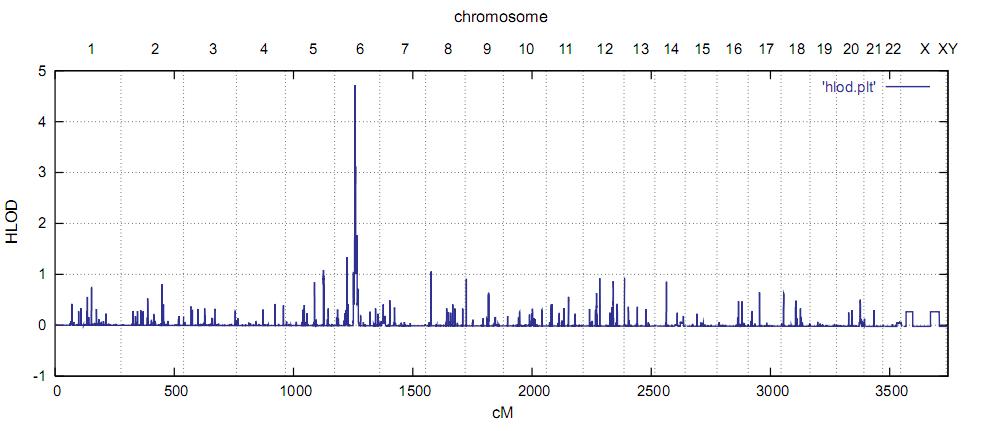
We used the Affymetrix GeneChip Human Mapping 250K Sty Array and the program Merlin with the recently implemented linkage disequilibrium (LD) modeling option to avoid inflated lod scores (Abecasis et al., 2005). We assigned arbitrarily second-cousin parents to all individuals of unknown consanguinity and carried out linkage analysis under the assumption of locus heterogeneity (HLOD calculation). We have used this approach successfully in previous mapping projects in which a high proportion of consanguineous families was assumed but not proven a priori (Crisponi et al., 2007). For cblF, this kind of linkage analysis yielded a single maximum HLOD score of 4.7 for the region 6q12-13 (Figure 1).
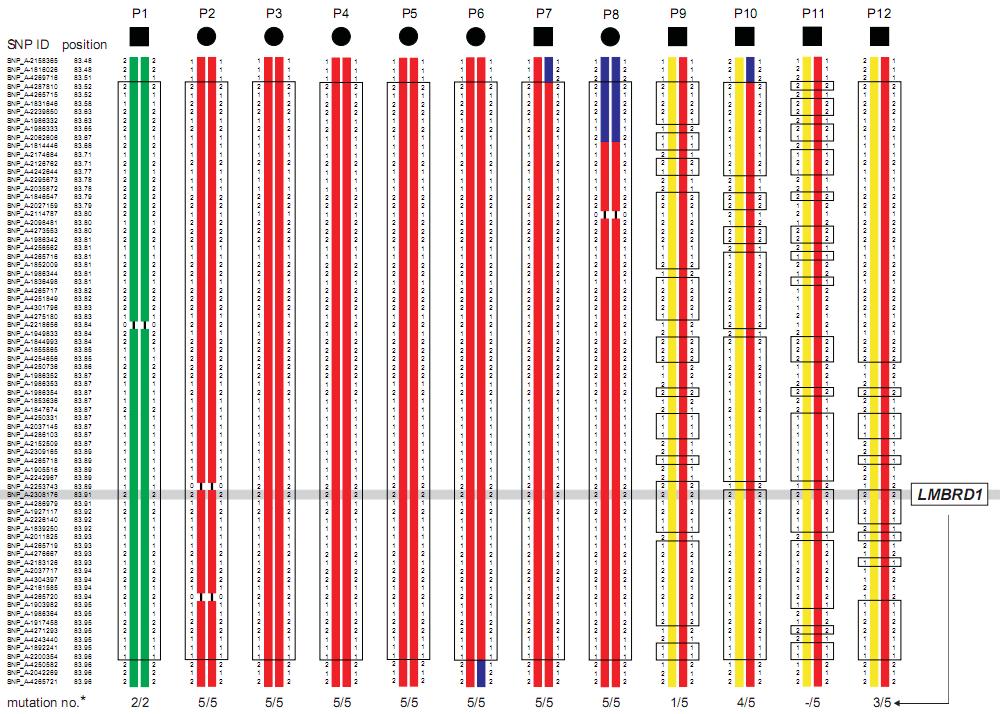
According to the haplotype data from affected individuals with extended homozygosity, the interval on chromosome 6 is delimited by the SNP markers SNP_A-4269716 and SNP_A-4250582 and comprises 1.62 Mb of genomic DNA (Figure 2). The proximal border could be shifted further toward the telomere to SNP_A-2062606, as indicated by the partially different haplotype of individual P8, thereby reducing the critical interval to 1.34 Mb. Only four affected individuals (P9 - P12) did not show a homozygous segment in this narrow interval, suggesting either compound heterozygosity or locus heterogeneity (Figure 2). Among the three genes annotated in this region on chromosome 6q13, we considered LMBRD1 as the most promising positional candidate gene (Figure 2) because its gene product, LMBD1, was known to be a membrane protein expressed in the liver14. Direct genomic sequencing of the 16 coding exons and flanking intronic regions of LMBRD1 identified homozygous and compound heterozygous deletion mutations in the LMBRD1 gene in all affected individuals.
Reference
Reference
Rutsch F, Gailus S, Miousse IR, Suormala T, Sagné C, Toliat MR, Nürnberg G, Wittkampf T, Buers I, Sharifi A, Stucki M, Becker C, Baumgartner M, Robenek H, Marquardt T, Höhne W, Gasnier B, Rosenblatt DS, Fowler B, Nürnberg P.: Identification of a putative lysosomal cobalamin exporter altered in the cblF defect of vitamin B(12) metabolism. Nat Genet. 2009 Feb;41(2):234-9
Outlook
More than 350 new disease loci have been mapped and quite a number of disease genes identified in collaboration with many groups from Germany and abroad. The projects include conventional linkage studies, homozygosity mapping and microdeletion screening.
Currently, the identification of mutations is further accelerated by next generation sequencing methods. Since the sequencing of whole genomes is still too expensive, targeted enrichment processes are used.
However, with falling prices, complete genome analysis of single affected individuals, will soon complement and in many cases replace gene mapping as tool to identify disease genes.
References
Abecasis GR, Cherny SS, Cookson WO, Cardon LR (2001): GRR: graphical representation of relationship errors. Bioinformatics 17: 742 743.
Abecasis GR, Cherny SS, Cookson WO, Cardon LR (2002): Merlin - rapid analysis of dense genetic maps using sparse gene flow trees. Nat Genet 30: 97-101.
Abecasis GR, Wigginton JE (2005): Handling marker-marker linkage disequilibrium: pedigree analysis with clustered markers. Am J Hum Genet 77: 754-67.
Gudbjartsson DF, Jonasson K, Frigge ML, Kong A (2000): Allegro, a new computer program for multipoint linkage analysis. Nat Genet 25(1): 12-13.
Kruglyak L, Daly MJ, Reeve-Daly MP, Lander ES (1996): Parametric and nonparametric linkage analysis: a unified multipoint approach. Am J Hum Genet 58: 1347-1363.
O'Connell JR, Weeks DE (1998): PedCheck: a program for identification of genotype incompatibilities in linkage analysis. Am J Hum Genet 63: 259-266.
Rüschendorf F, Nürnberg P (2005): ALOHOMORA: a tool for linkage analysis using 10K SNP array data. Bioinformatics 21(9): 2123-2125.
Strauch K, Fimmers R, Kurz T, Deichmann KA, Wienker TF, Baur MP (2000): Parametric and nonparametric multipoint linkage analysis with imprinting and two-locus-trait models: application to mite sensitization. Am J Hum Genet 66: 1945- 1957.
Thiele H, Nürnberg P (2005): HaploPainter: a tool for drawing pedigrees with complex haplotypes. Bioinformatics 21(8): 1730-1732.
Contact
Please contact the Genotyping Team via ccg-genotyping![]() uni-koeln.de.
uni-koeln.de.